
Welcome to this tutorial. In this tutorial, we will build an MDX dataset base on the public dataset KYLIN_SALES, showing how to create and use datasets for analysis in Excel. Chapter Quick Navigation:
- What you will know
- Prerequisites
- Preparation
- Create MDX Dataset
- Analysis in Excel
- Source Code
What you will know
In this tutorial you will learn about the following:
- How to create MDX datasets in
MDX for Kylin. - How to create hierarchies and commonly used calculated measures (eg YTD, QTD, MTD, YOY and MOM) in
MDX for Kylin’s dataset. - How to modify dimension table attributes, dimension attributes, measure attributes, and dimension usage in
MDX for Kylin’s dataset. - How to analysis in Excel.
More details about usage of MDX for Kylin, please access to Manual of MDX for Kylin.
Prerequisites
To complete all the lessons in this tutorial, you will need to prepare the following:
- This tutorial mainly uses Docker of MDX for Kylin as a demonstration.
- Complete the installation of Docker of MDX for Kylin, as described in Quickly try MDX for Kylin.
- Prepare
Kylin Salescube which status must be ready in Kylin.
Preparation
-
Create Models/Cubes in Kylin
The current docker environment starts with the
learn_kylinproject by default, and generateskylin_sales_modelandkylin_sales_cube.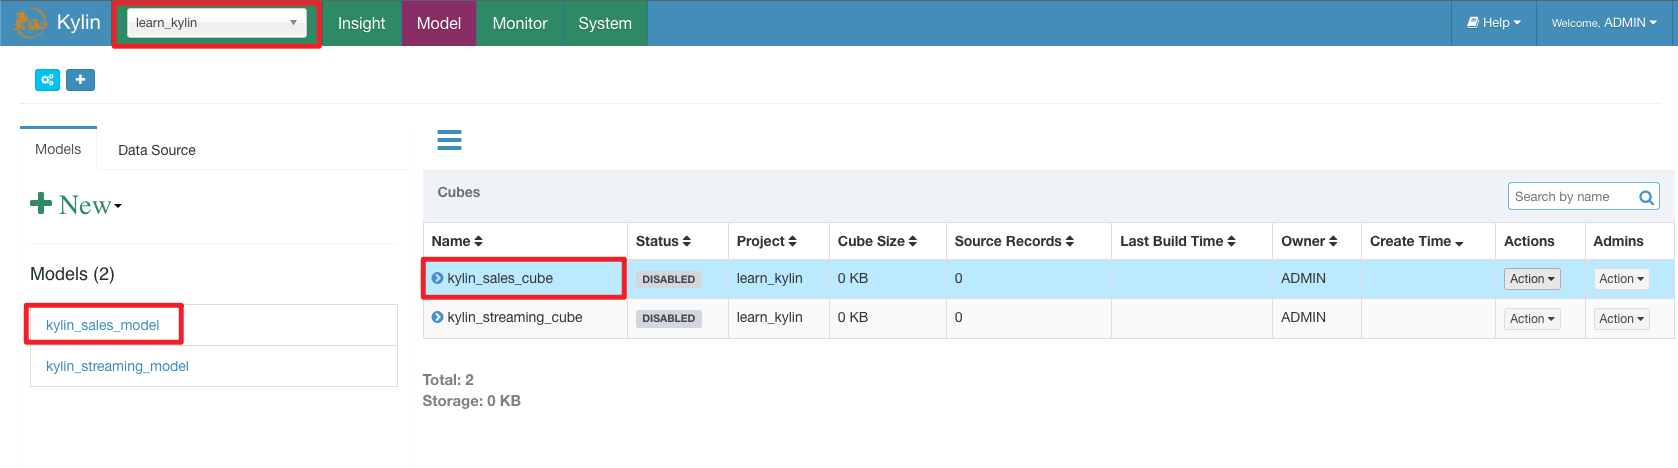
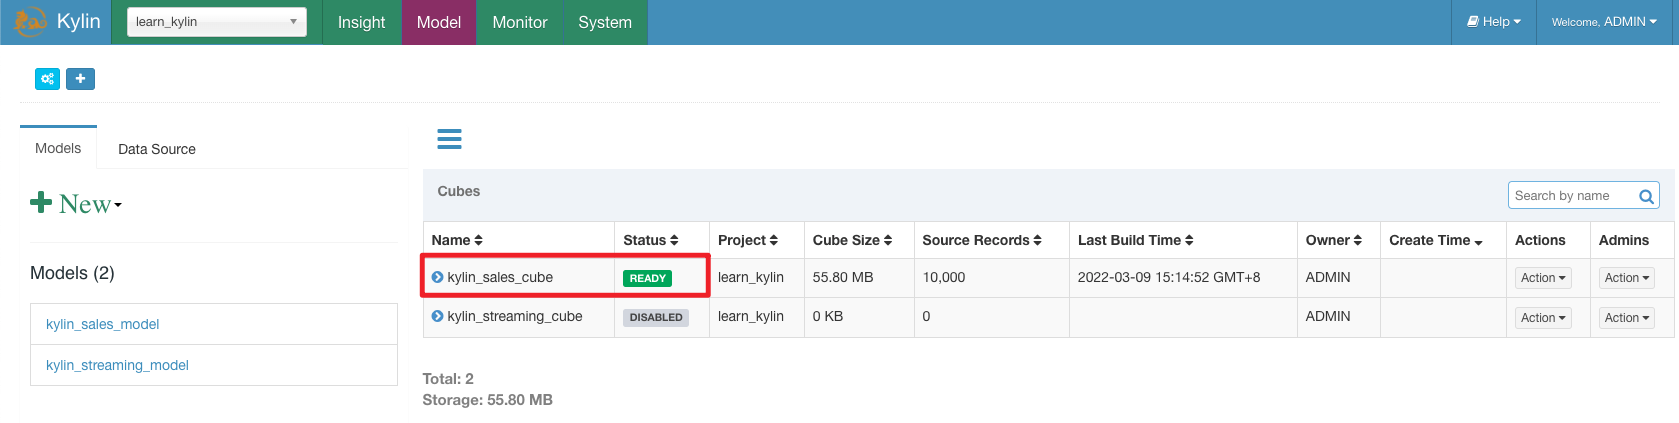
-
Build
kylin_sales_cube.
Create MDX Dataset
At this point, we have completed the preparation work, and then we should start creating MDX dataset.
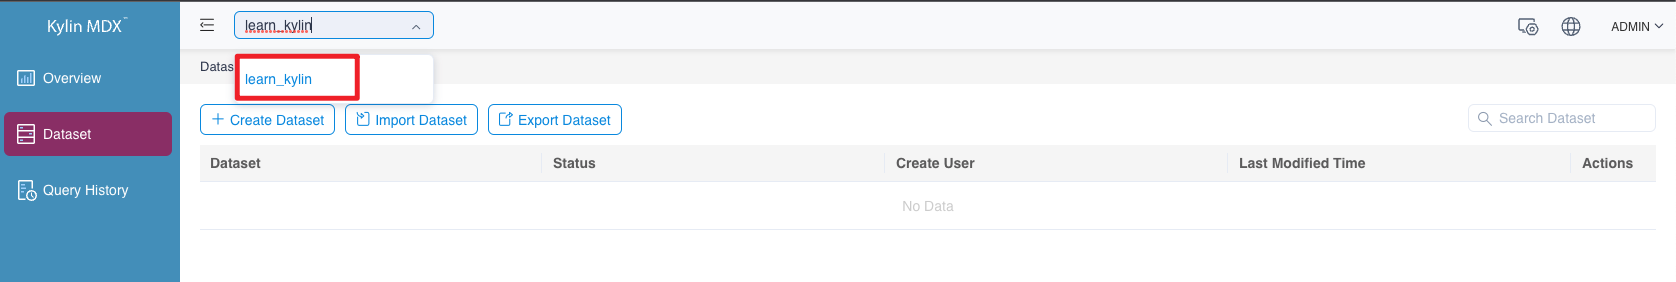
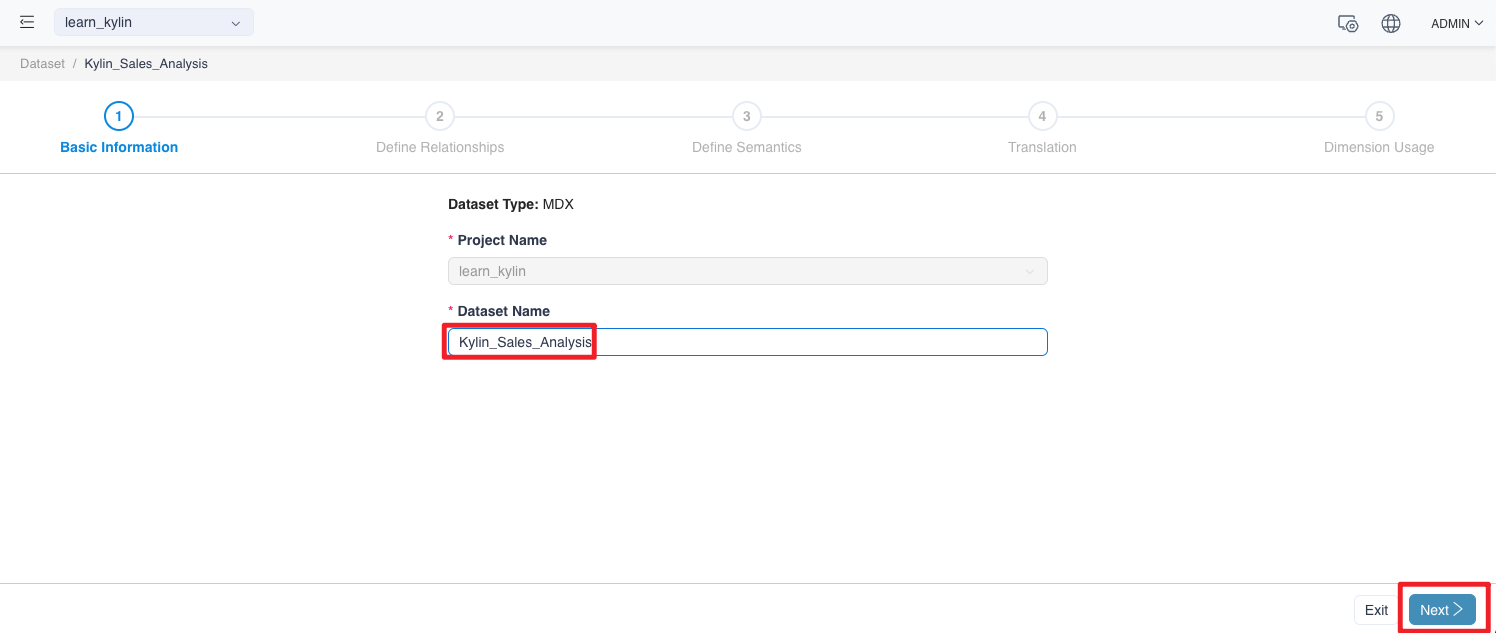
Fill in the basic information
-
Since the Cube in Kylin is created in the project
learn_kylin, the project name in MDX for Kylin should belearn_kylin.
-
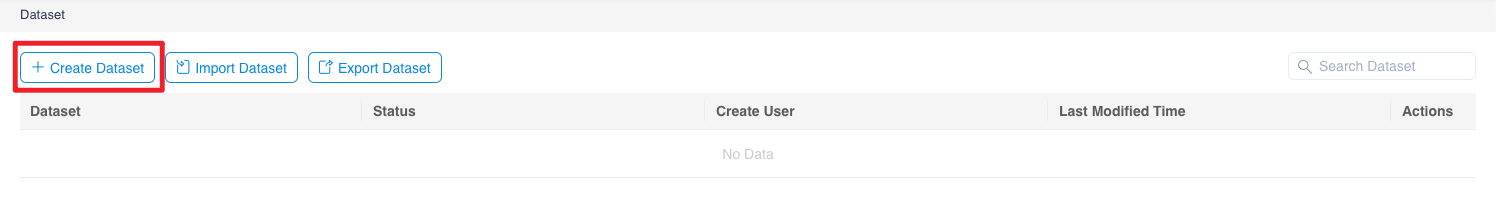
Open the Dataset menu and click the + Create Dataset button.
-
Click to start creating a dataset.
Fill in the dataset Name with *Kylin_Sales_Analysis*.
Click Next button when done.
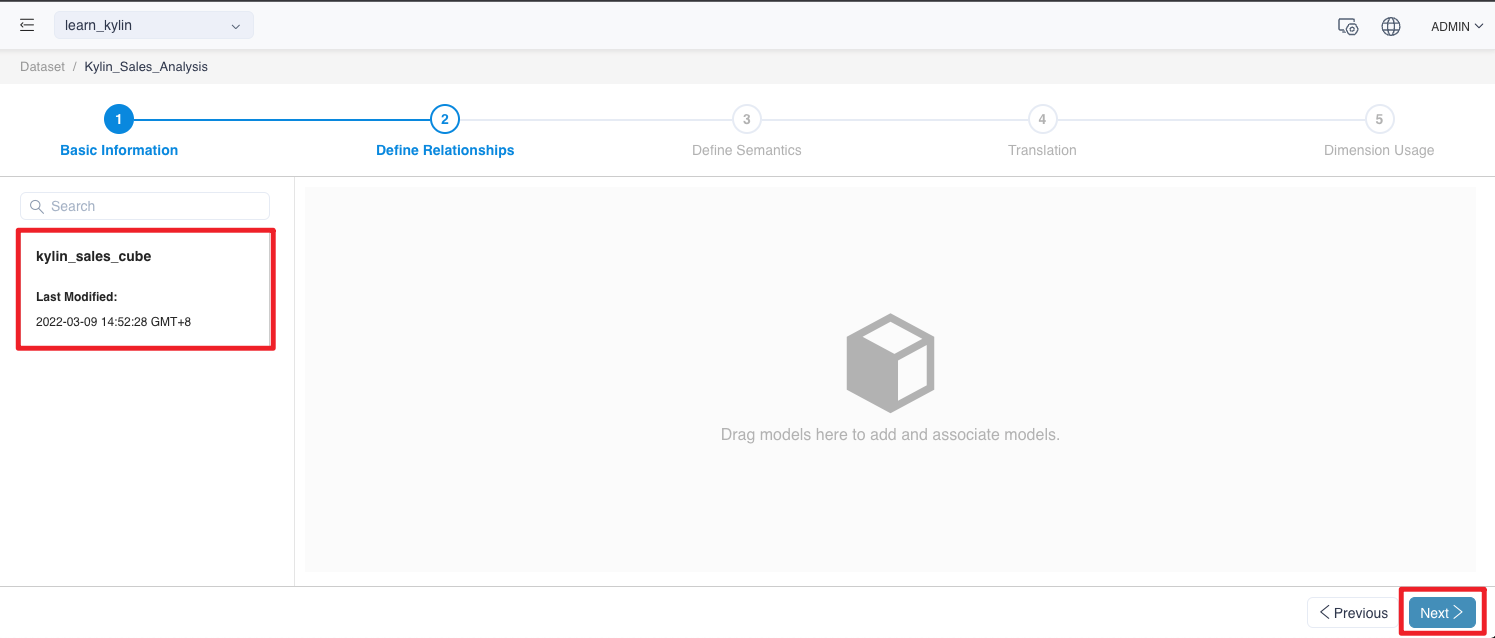
Define Relationships
This analysis will simply analyze whether there is a relationship between the data about Kylin_Sales.
Drag kylin_sales_cube to the right pane. Click the Next button when done.
Modify dimension name and measure name
To increase readability, we can change the names of dimensions and measures.
Modify the dimension name
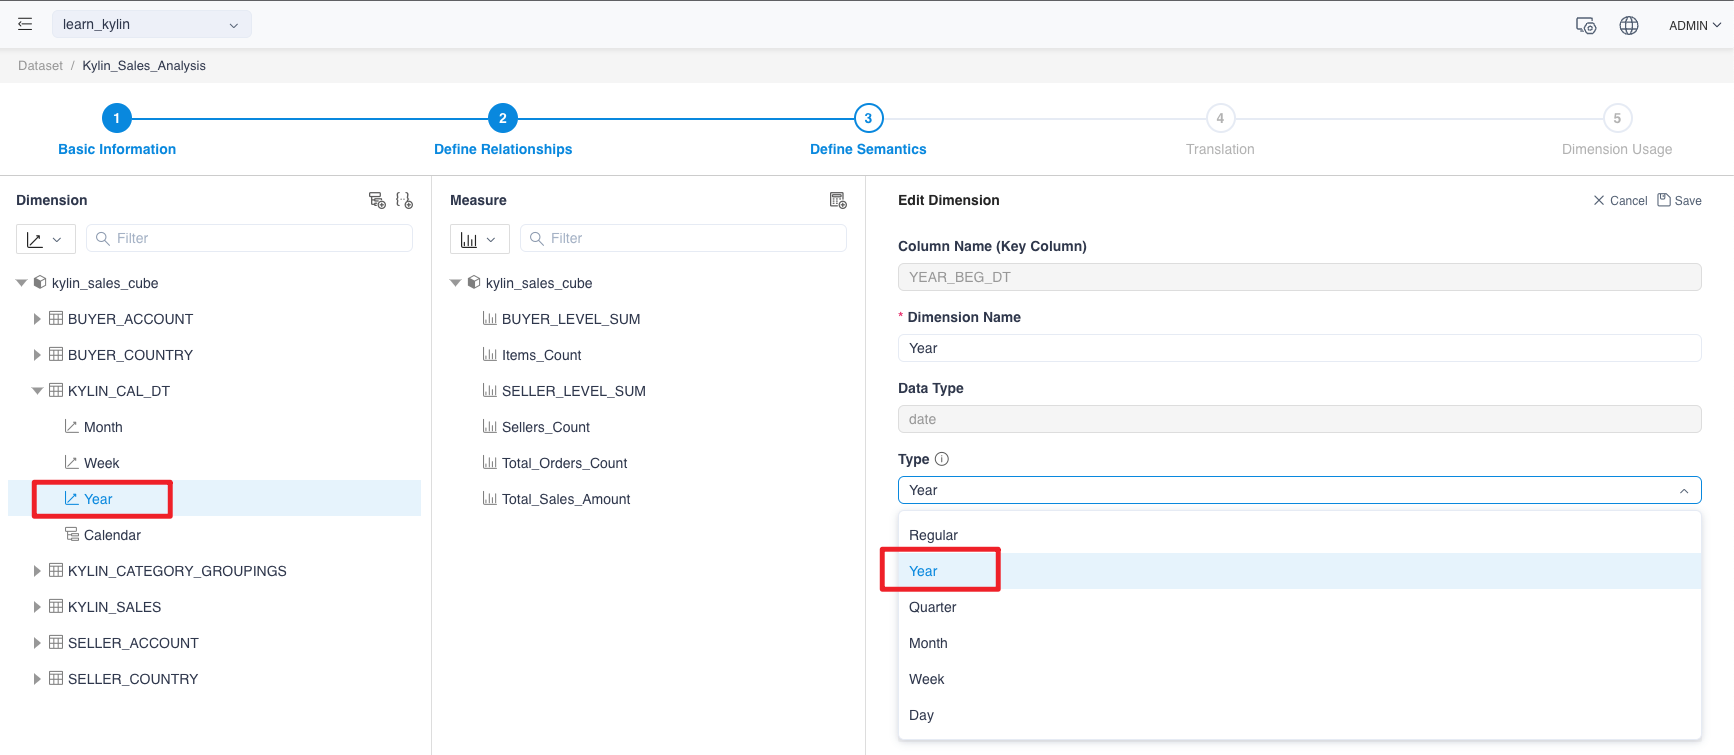
- Click on the Dimension Name on the left side of the Define Semantics page to display the dimension details.
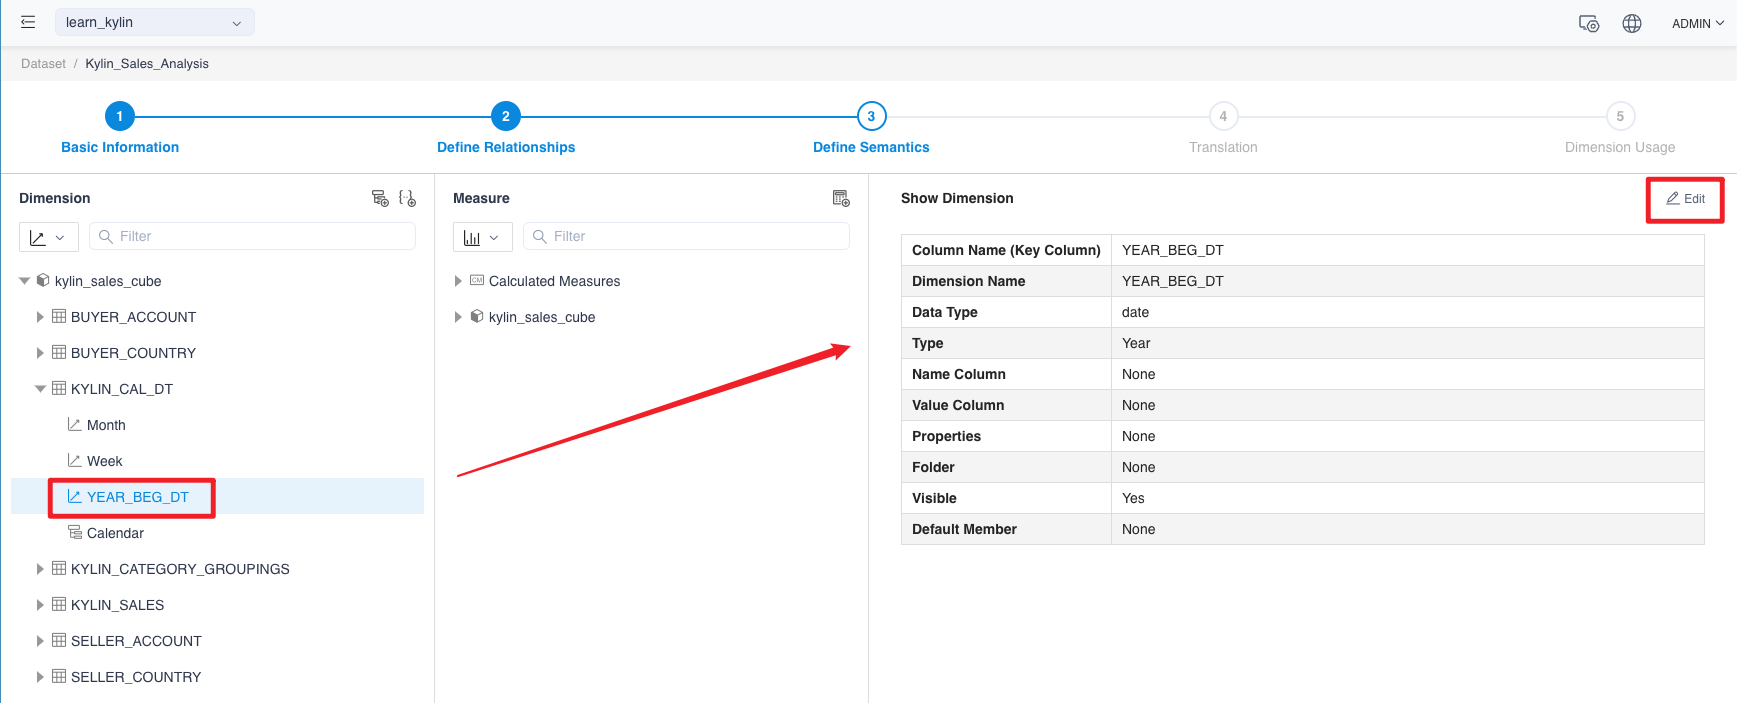
-
On the Display Dimension Details page, click the Edit button to go to the edit page to change dimension name from YEAR_BEG_DT to YEAR.
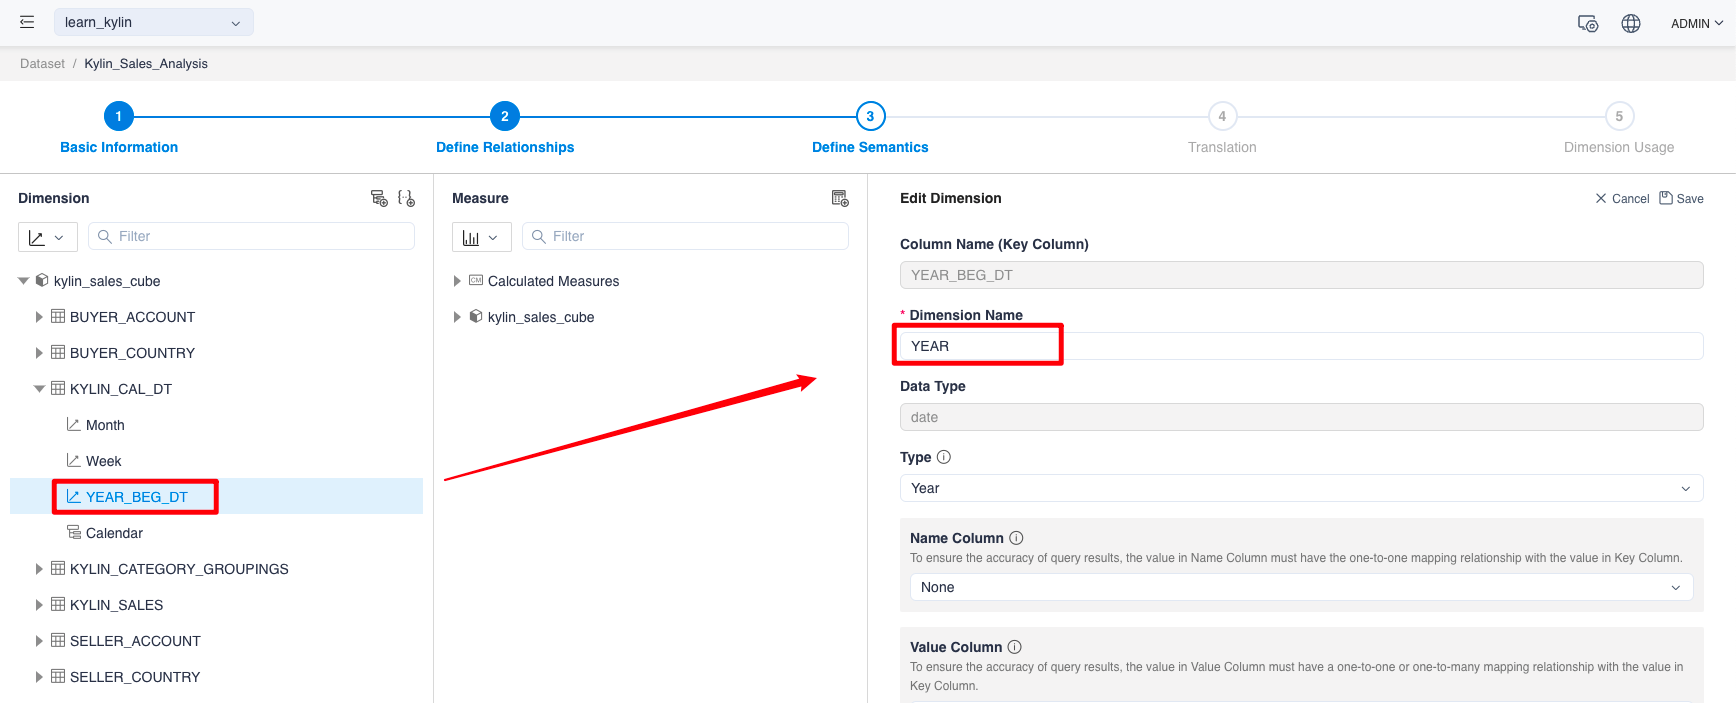
- On the same way, we could change the dimension name by the following table:
| Cube Name | Table Name | Original Name | Changed Name |
|---|---|---|---|
| kylin_sales_cube | KYLIN_CAL_DT | YEAR_BEG_DT | Year |
| kylin_sales_cube | KYLIN_CAL_DT | MONTH_BEG_DT | Month |
| kylin_sales_cube | KYLIN_CAL_DT | WEEK_BEG_DT | Week |
Modify the measure name
-
Similarly, click on the measure name on the left side of the definition semantics page to display the metric details.
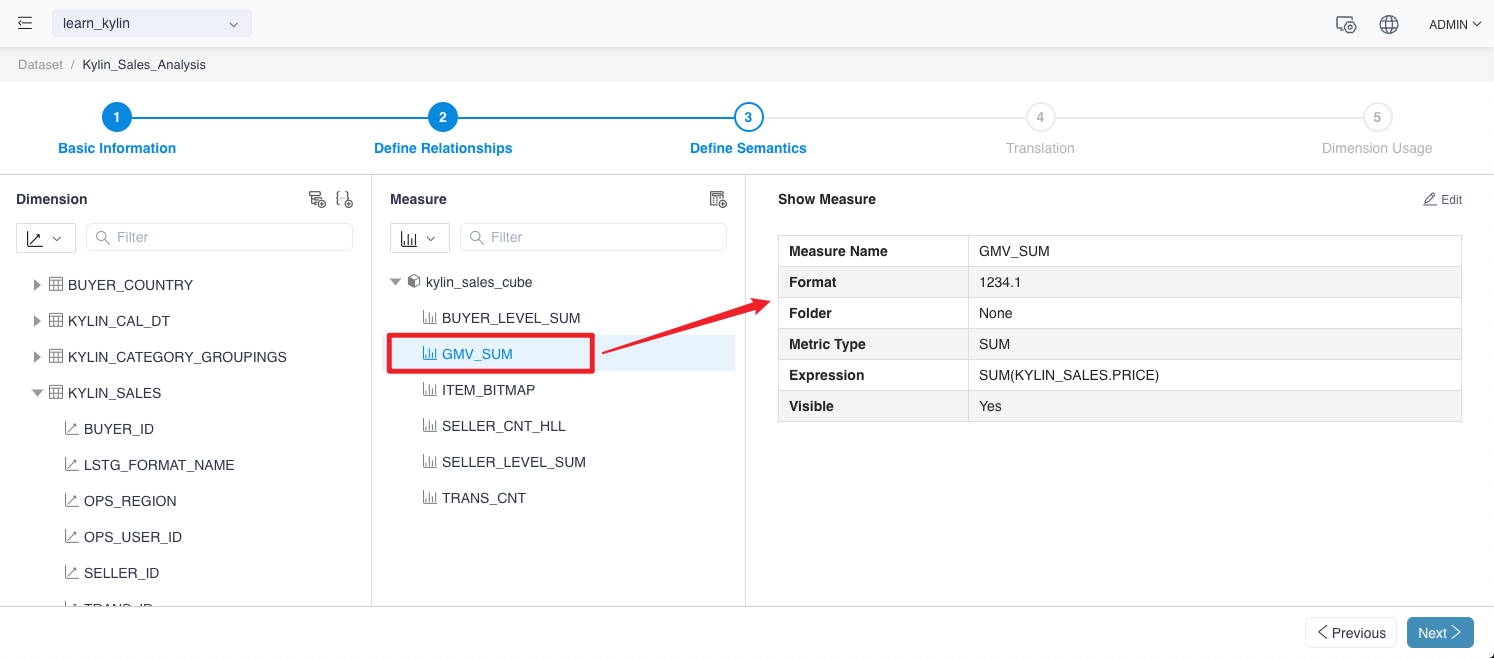
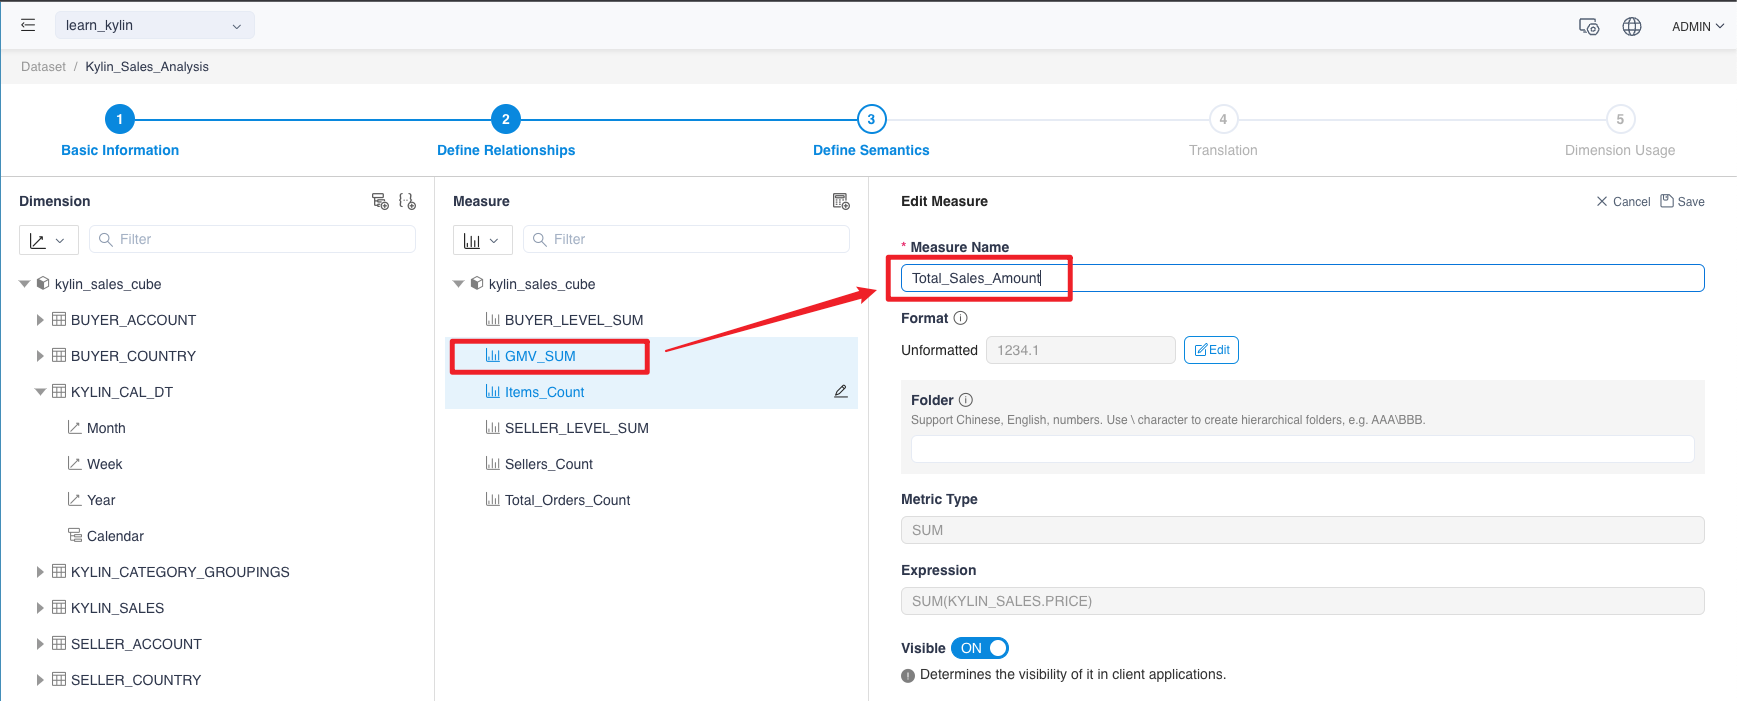
- On the Display Metrics Details page, click the Edit button to go to the Edit page to change dimension name from GMV_SUM to Total_Sales_Amount.
- On the same way, we could change the measure name according to the table below:
| Cube Name | Original Name | Changed Name |
|---|---|---|
| kylin_sales_cube | TRANS_CNT | Total_Orders_Count |
| kylin_sales_cube | SELLER_CNT_HLL | Sellers_Count |
| kylin_sales_cube | ITEM_BITMAP | Items_Count |
| kylin_sales_cube | GMV_SUM | Total_Sales_Amount |
Modify dimension table attributes and dimension attributes
In order to calculate time intelligence functions such as YTD, MTD, and QTD, it is necessary to adjust the attributes of the related dimension tables and dimensions. We need to change the dimension table property to a time type, and the dimension attributes of year, season and month to year, season and month respectively.
-
Modify dimension table properties
Click on the Dimension Table Name on the left side of the Define Semantic page to display the dimension table details.
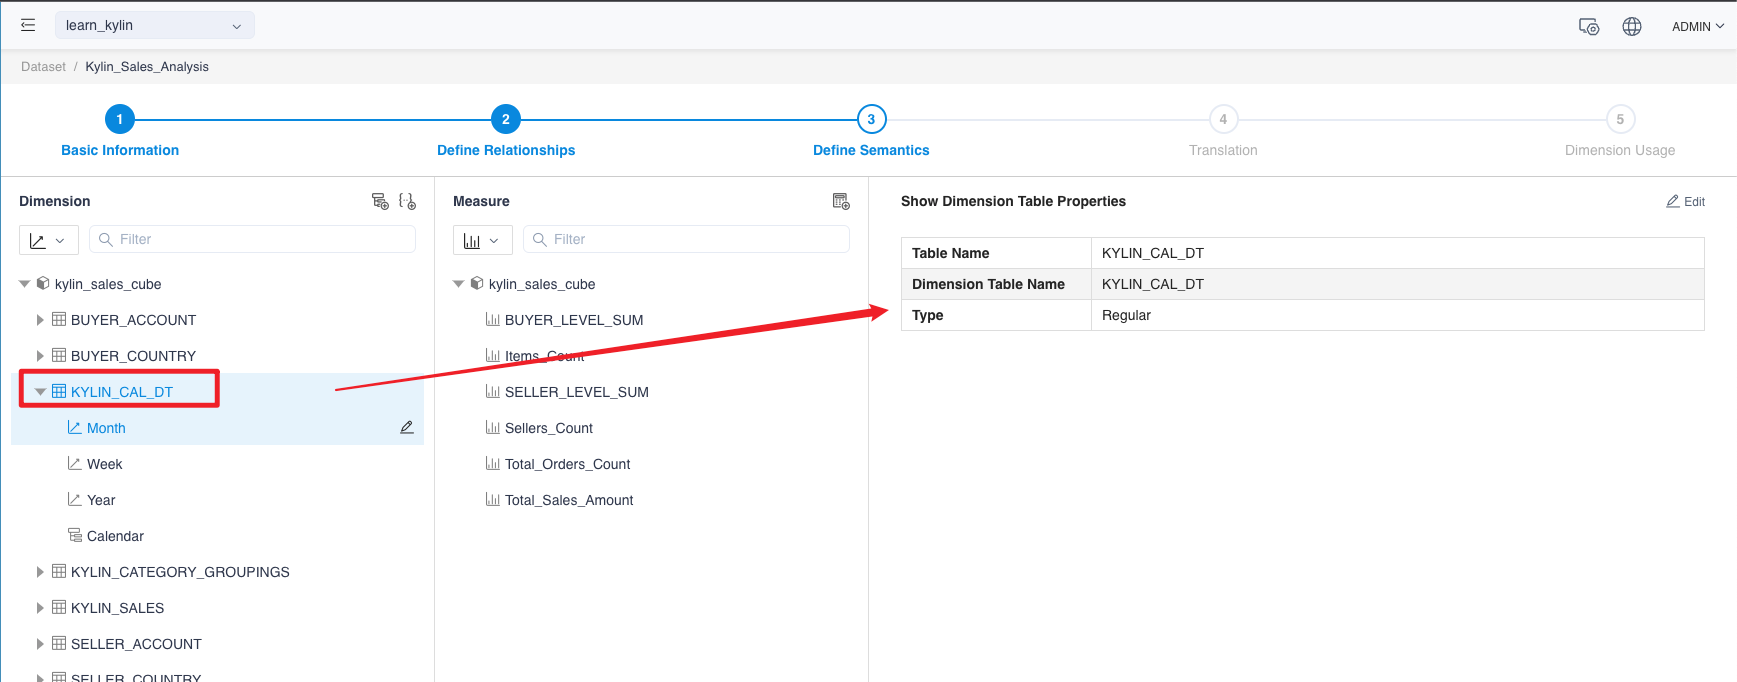
On the
Show Dimension Table Propertiespage, click the Edit button to go to the edit page, where the dimension table properties are changed from regular to time.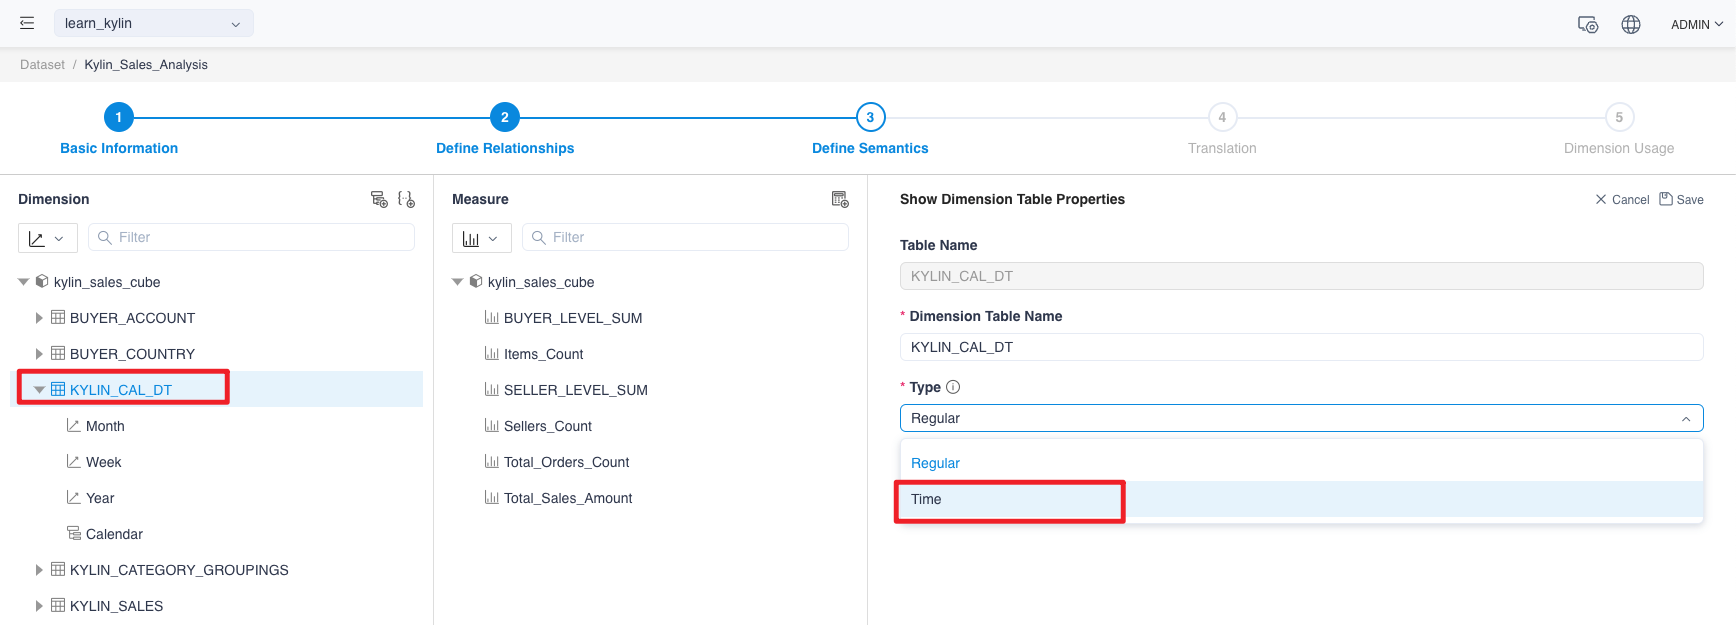
-
Modify dimension attributes
According to the method described above, you can change the properties of the edit dimension property page. Here you need to change the properties of the dimension year, quarter and month to year, season and month, and week.
Create Hierarchies
For time dimensions, such as the year, month, day, and other dimensions with hierarchical structure, we generally establish a hierarchy for analysis.
Notes:
If you need to use time intelligence functions such as YTD, QTD, MTD, WTD, there are the following precautions:
- Calendar hierarchy must be established.
- The attributes of the dimensions in the hierarchy are specified as year, season, month, week, and day respectively.
- When using time intelligence functions in Excel, you need to drag the hierarchy into rows or columns.
Click the Add Hierrachy button to add a hierarchy. Here, due to the needs of the analysis, create a hierarchiy called the calendar with dimensions of year, quarter, month, and date.
Note:
Dimensions in the hierarchy need to be selected in order of concept, for example, year, month, week, and then day.
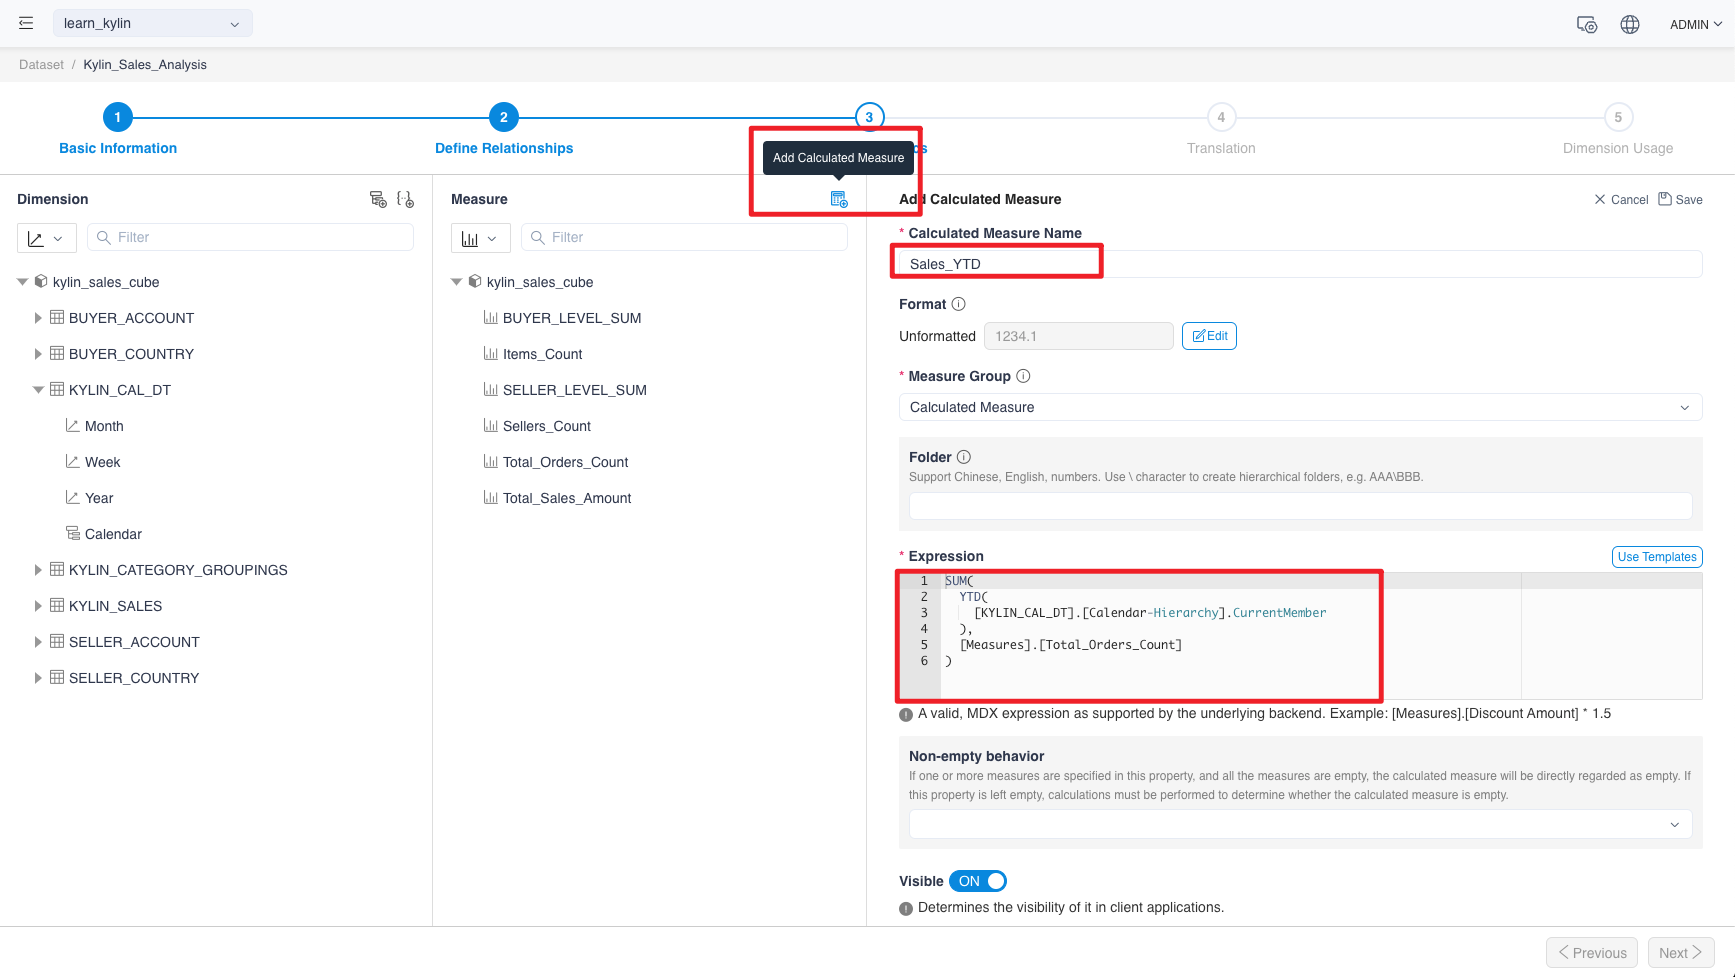
Create Calculated Measures
Add a calculated measure by clicking the Add Calculated Measure button.
The table below lists common expressions, which you could refer to in your projects.
| Calculated Measures | Format String | MDX Expression |
|---|---|---|
| Sales_YTD | #,###,00 | SUM(YTD([DATE_DIM].[calendar-Hierarchy].CurrentMember),[Measures].[Sales_Qty]) |
| Sales_QTD | #,###,00 | SUM(QTD([DATE_DIM].[calendar-Hierarchy].CurrentMember),[Measures].[Sales_Qty]) |
| Sales_MTD | #,###,00 | SUM(MTD([DATE_DIM].[calendar-Hierarchy].CurrentMember),[Measures].[Sales_Qty]) |
| Sales_PM | #,###,00 | SUM(ParallelPeriod([DATE_DIM].[calendar-Hierarchy].[Month],1,[DATE_DIM].[calendar-Hierarchy].CurrentMember),[Measures].[Sales_Qty]) |
| Sales_PQ | #,###,00 | SUM(ParallelPeriod([DATE_DIM].[calendar-Hierarchy].[Quarter],1,[DATE_DIM].[calendar-Hierarchy].CurrentMember),[Measures].[Sales_Qty]) |
| Sales_PY | #,###,00 | SUM(ParallelPeriod([DATE_DIM].[calendar-Hierarchy].[Year],1,[DATE_DIM].[calendar-Hierarchy].CurrentMember),[Measures].[Sales_Qty]) |
| Sales_MOM | 0.00% | ([Measures].[Sales_Qty]-[Measures].[Sales_PM])/[Measures].[Sales_PM] |
| Sales_YOY | 0.00% | ([Measures].[Sales_Qty]-[Measures].[Sales_PY])/[Measures].[Sales_PY] |
Define Translation
In MDX for Kylin, you can embed multiple translation of a caption to provide culture-specific strings based on the localed identifier (LCID).
This feature helps international teams to consume the same dataset without the need to repeatedly defining the dataset for localization purposes.
Note
- There are three language supported: Chinese, English(US), and English(UK).
- The objects that can be set are names of the dimension table, dimension, measure, calculated measure, and hierarchy. If a dimension is defined with a translation, then it will also be applied in the hierarchy containing the dimension.
- If the language in the analysis application client is not defined in the dataset translation, the dataset will use the default language. When using Excel, Excel will pass the LCID as language settings in Excel. For Tableau users, the language settings of the Windows system will be applied, so you can change the translations of the dataset displayed in Tableau by changing the language setting of the Windows system.
- When creating a new calculated measure, please reference the measure in the original name, instead of the translation in the MDX expression.
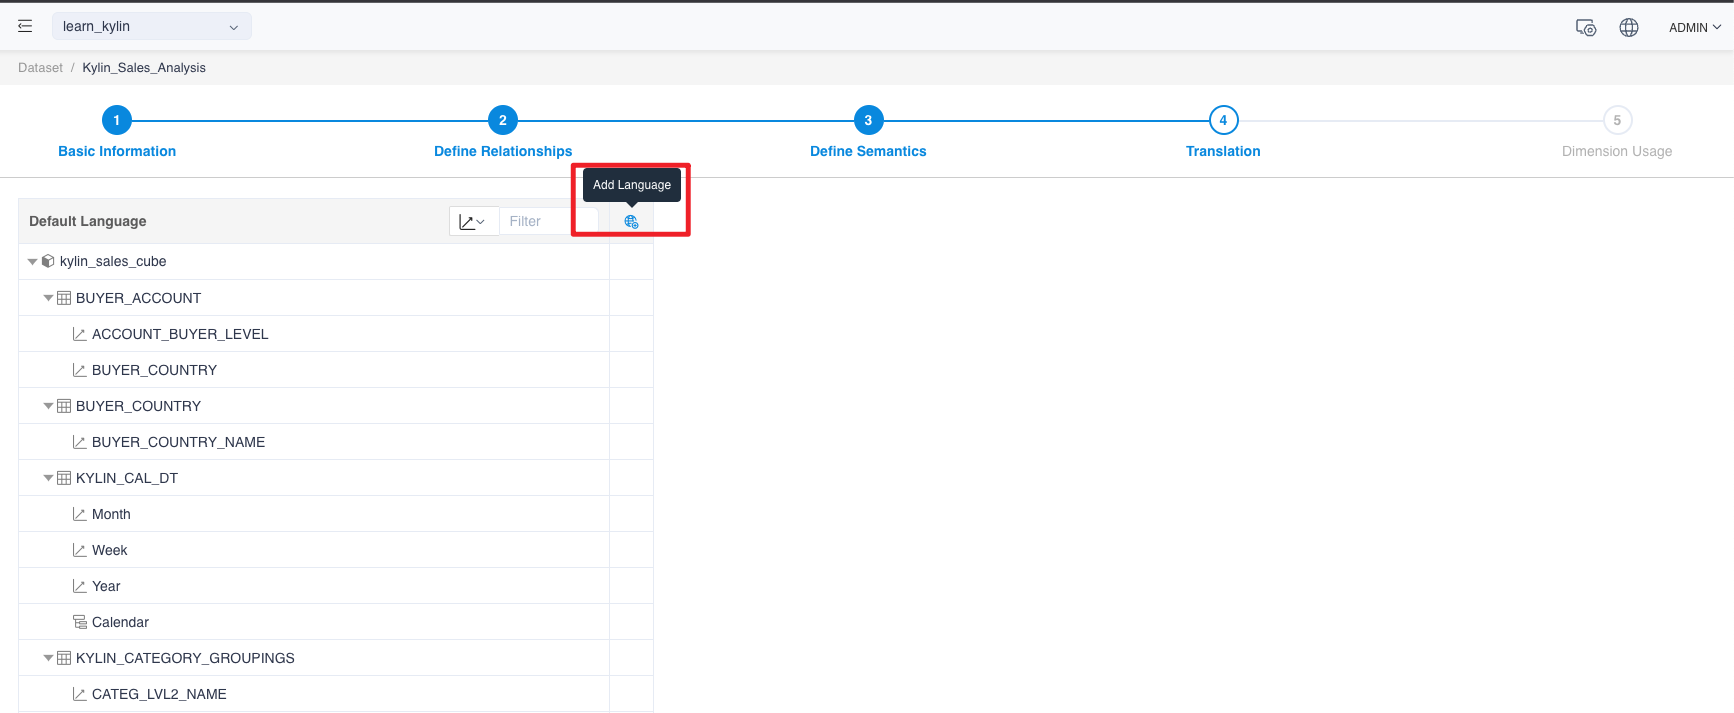
How to set translation
-
When editing a dataset, go to translation, click the globe icon to add a language.
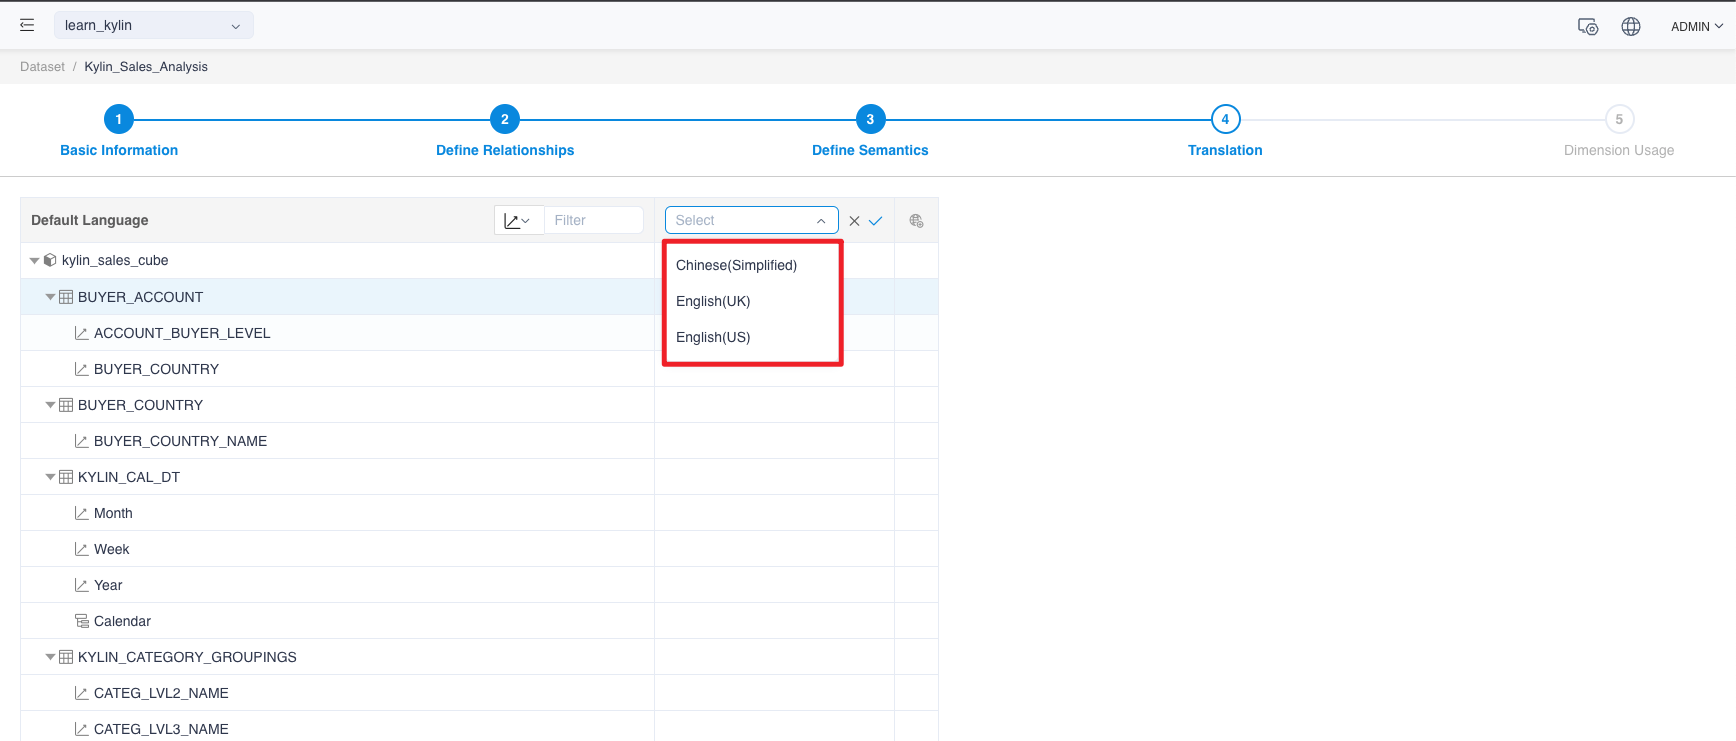
-
Choose a language in the new column and click confirm.
-
In this new group of translation, the user can input the translation of table names, dimensions or measures.
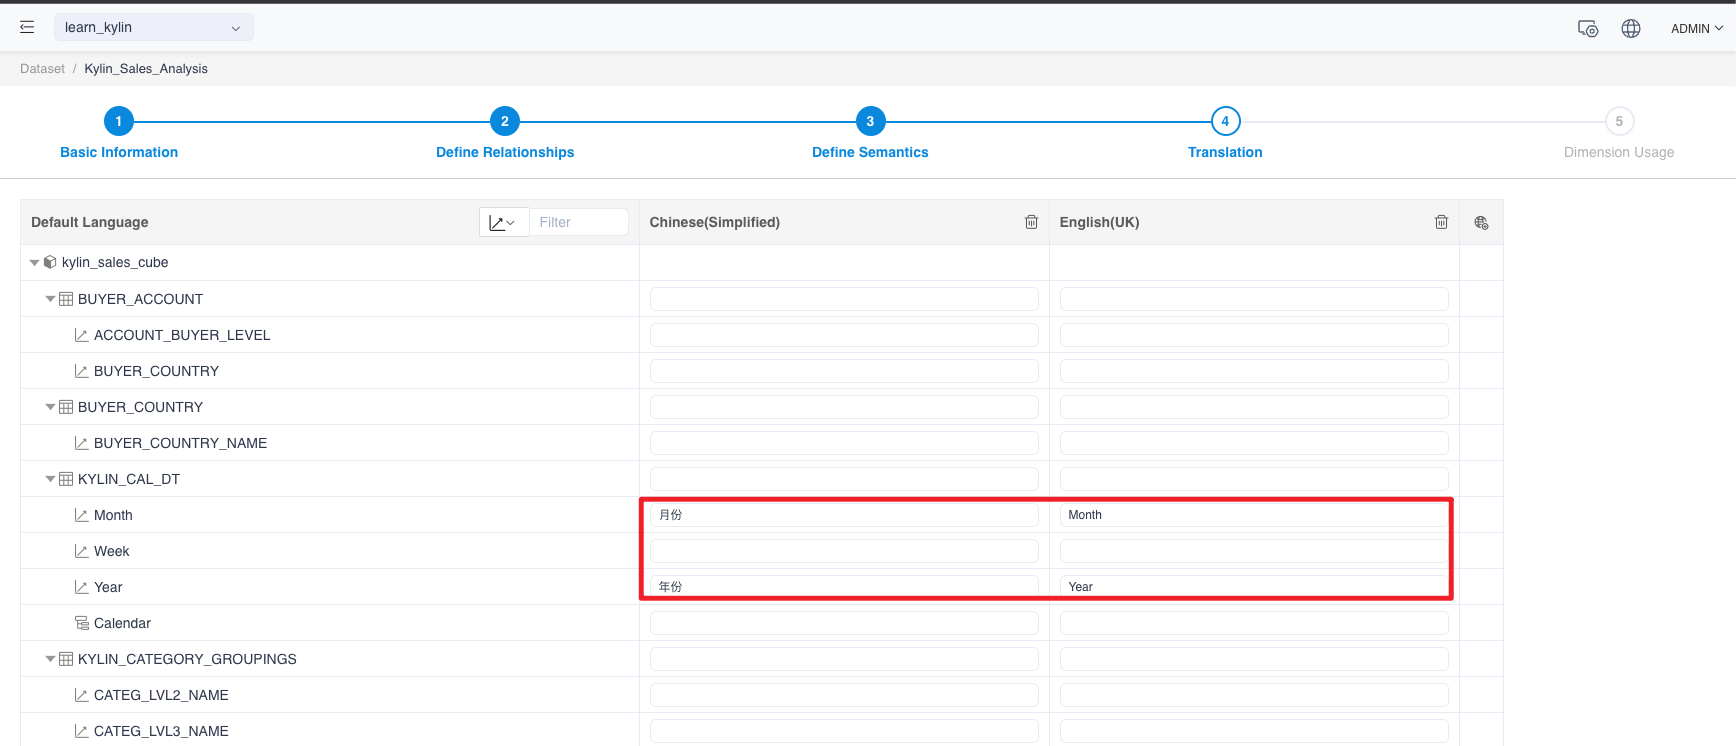 The above translation defines the Chinese-English translation of the year and month.
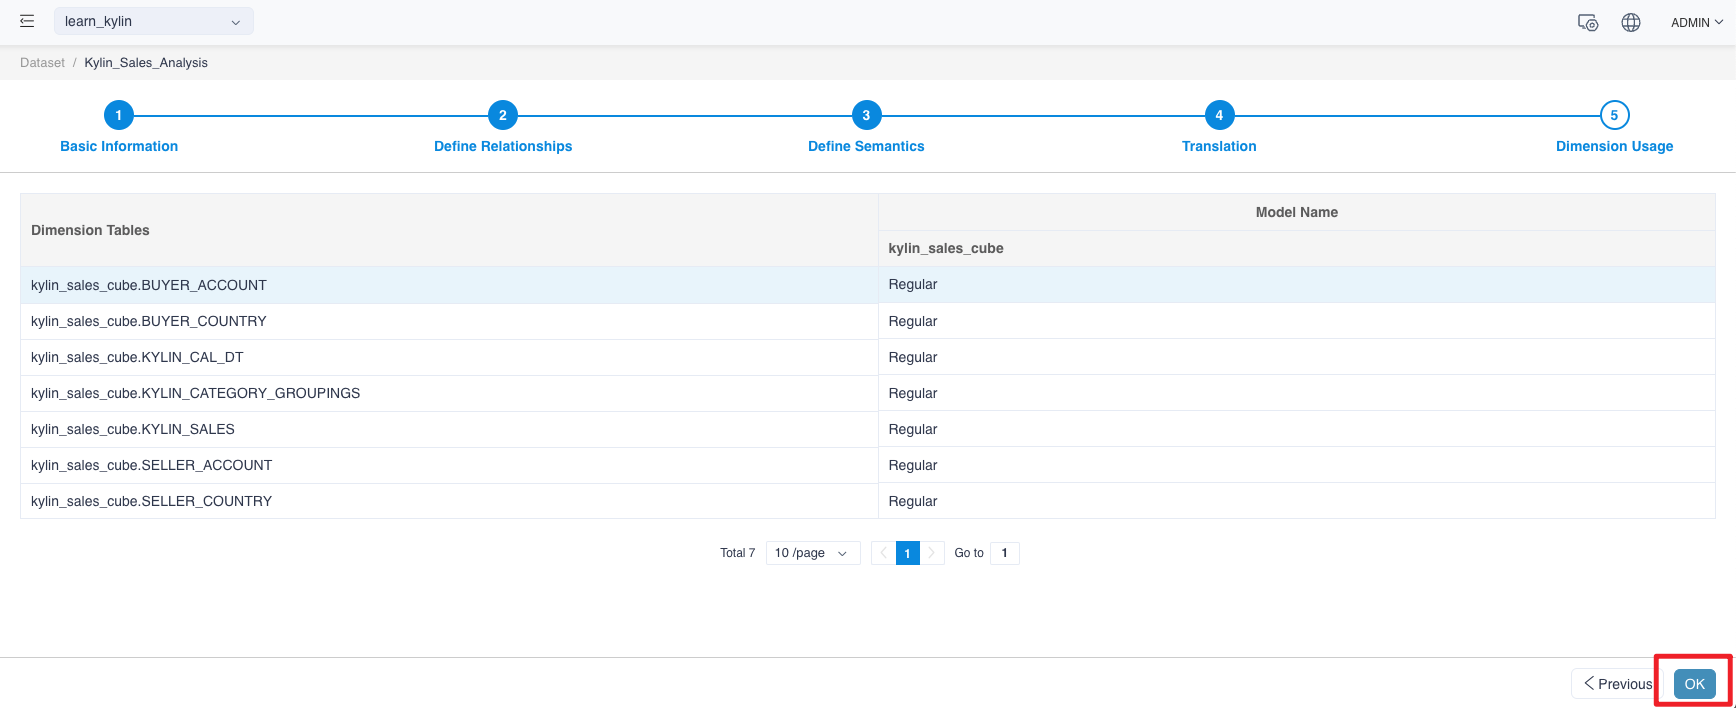
Edit Dimension Usage
Since Kylin does not support complex many-to-many relationships, so there is no special definition here.
Save and Create
Now that you have completed the main work of creating a data set in this tutorial, click the OK button.
Analysis in Excel
We have completed the definition of the data set, and now we can connect to Excel for analysis.
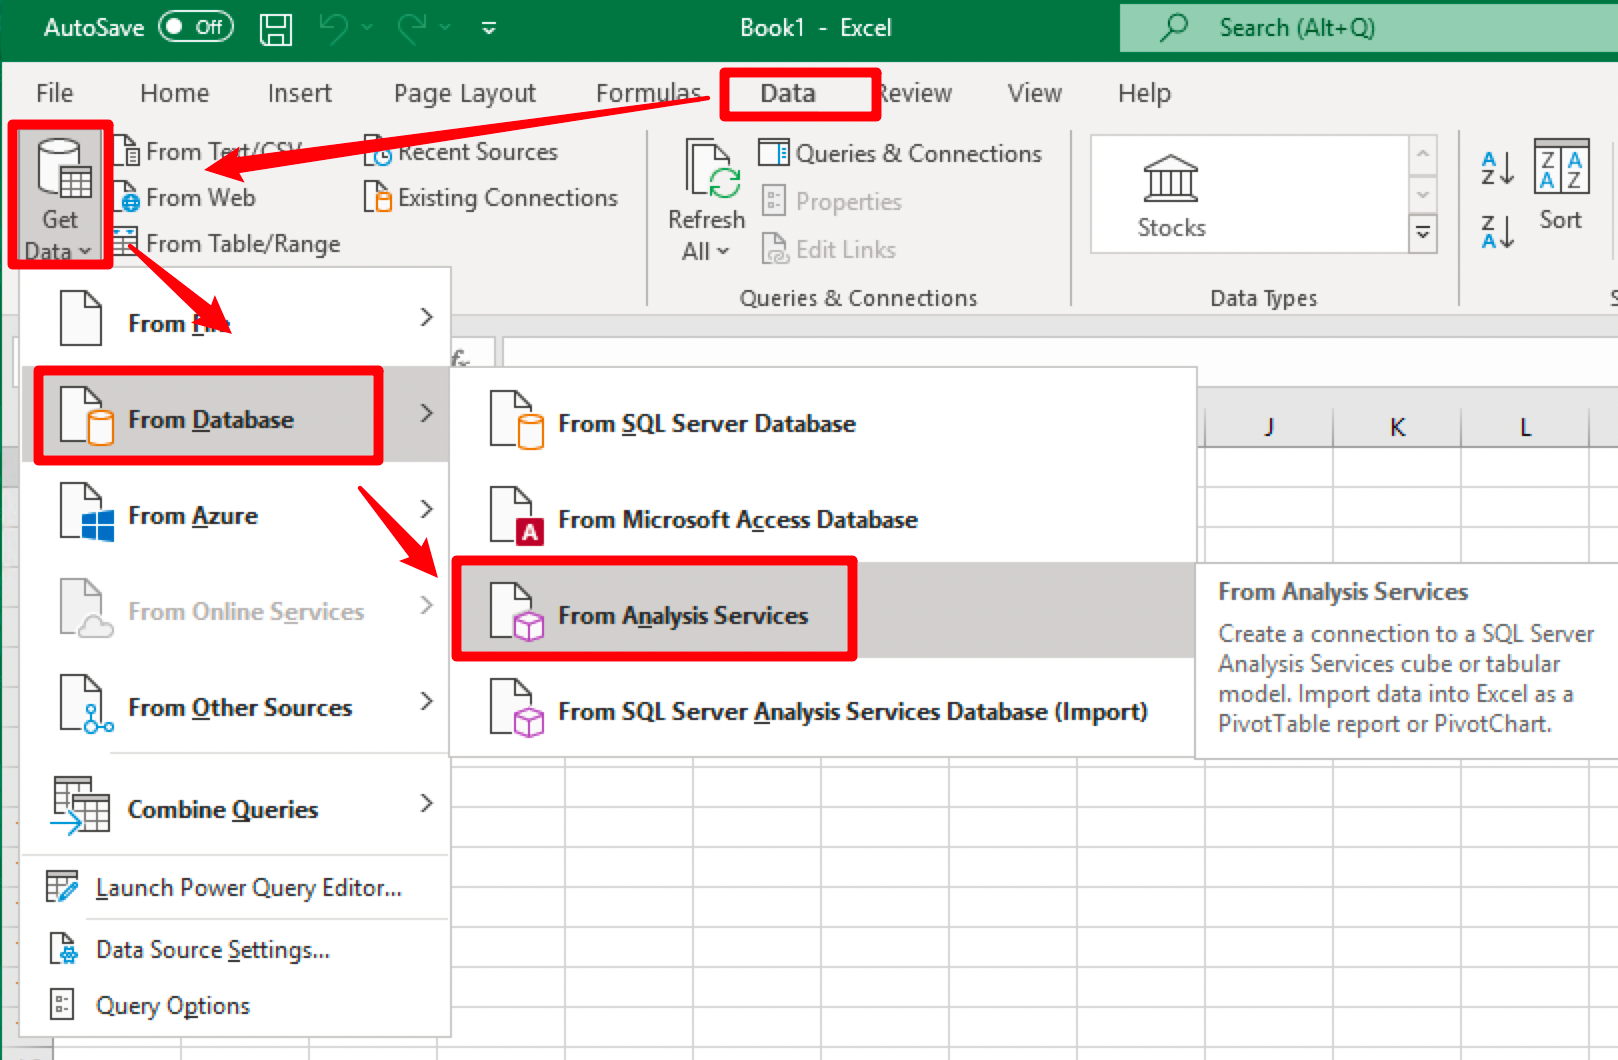
-
Select Data —> From Analysis Services
-
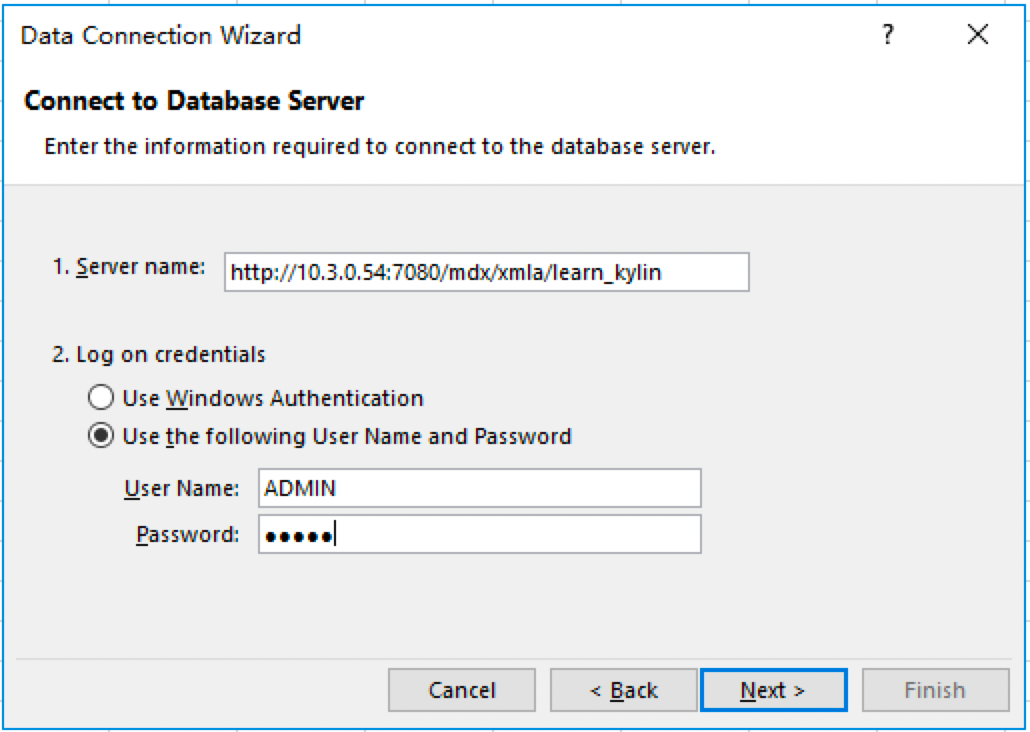
Next you need to fill in the address information of MDX for Kylin in the Server Name column. The sample is as follows:
http://{host}:{port}/mdx/xmla/{project}
The default port of MDX for Kylin is 7080.
The username and password are your MDX for Kylin’s login username and password.
-
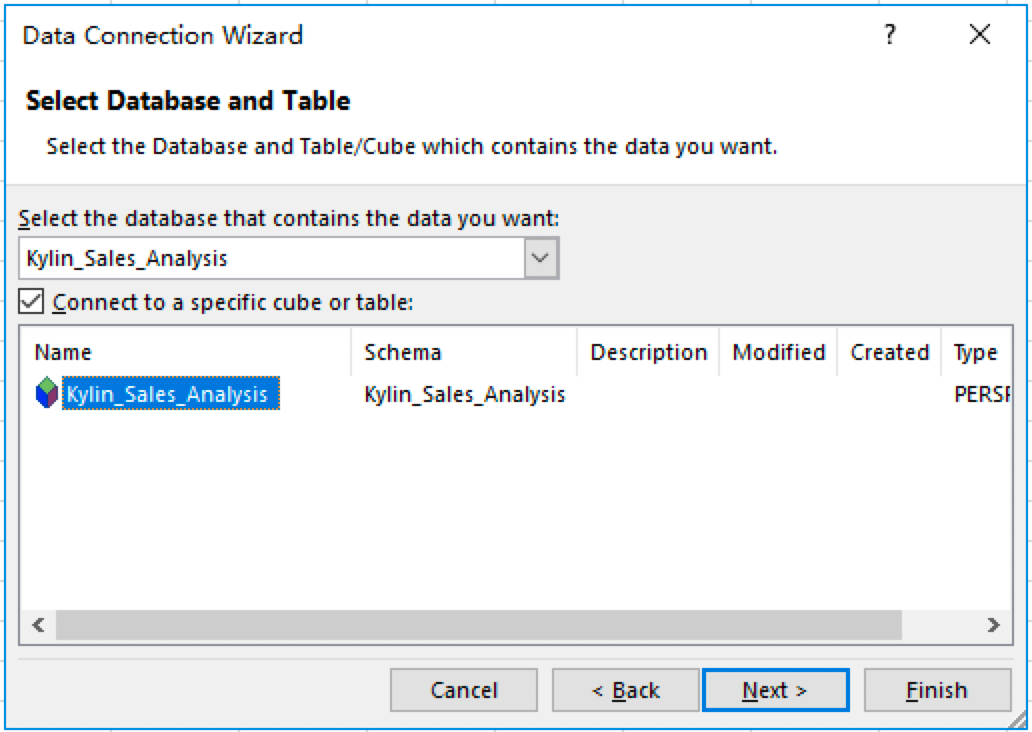
Now the Dataset is connected to Excel. Select the previously created dataset *Kylin_Sales_Analysis* and click Next.
-
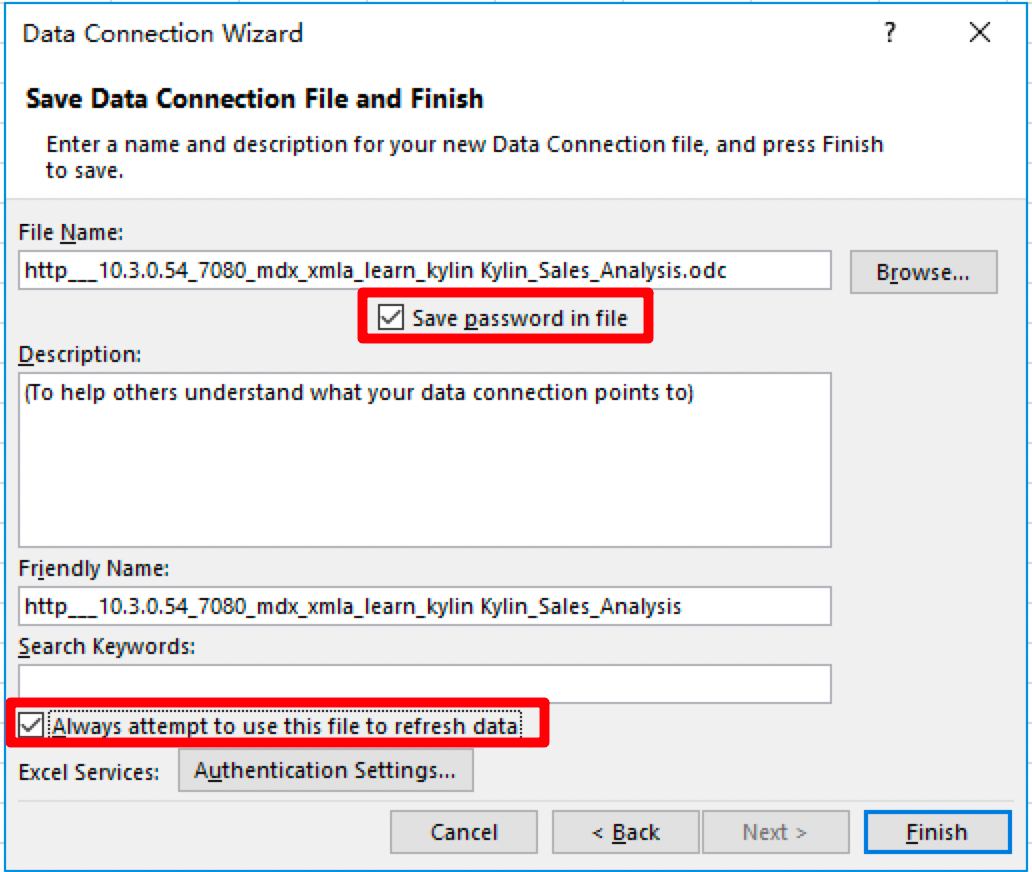
Check Always attempt to use this file to refresh the data and click Finish.
-
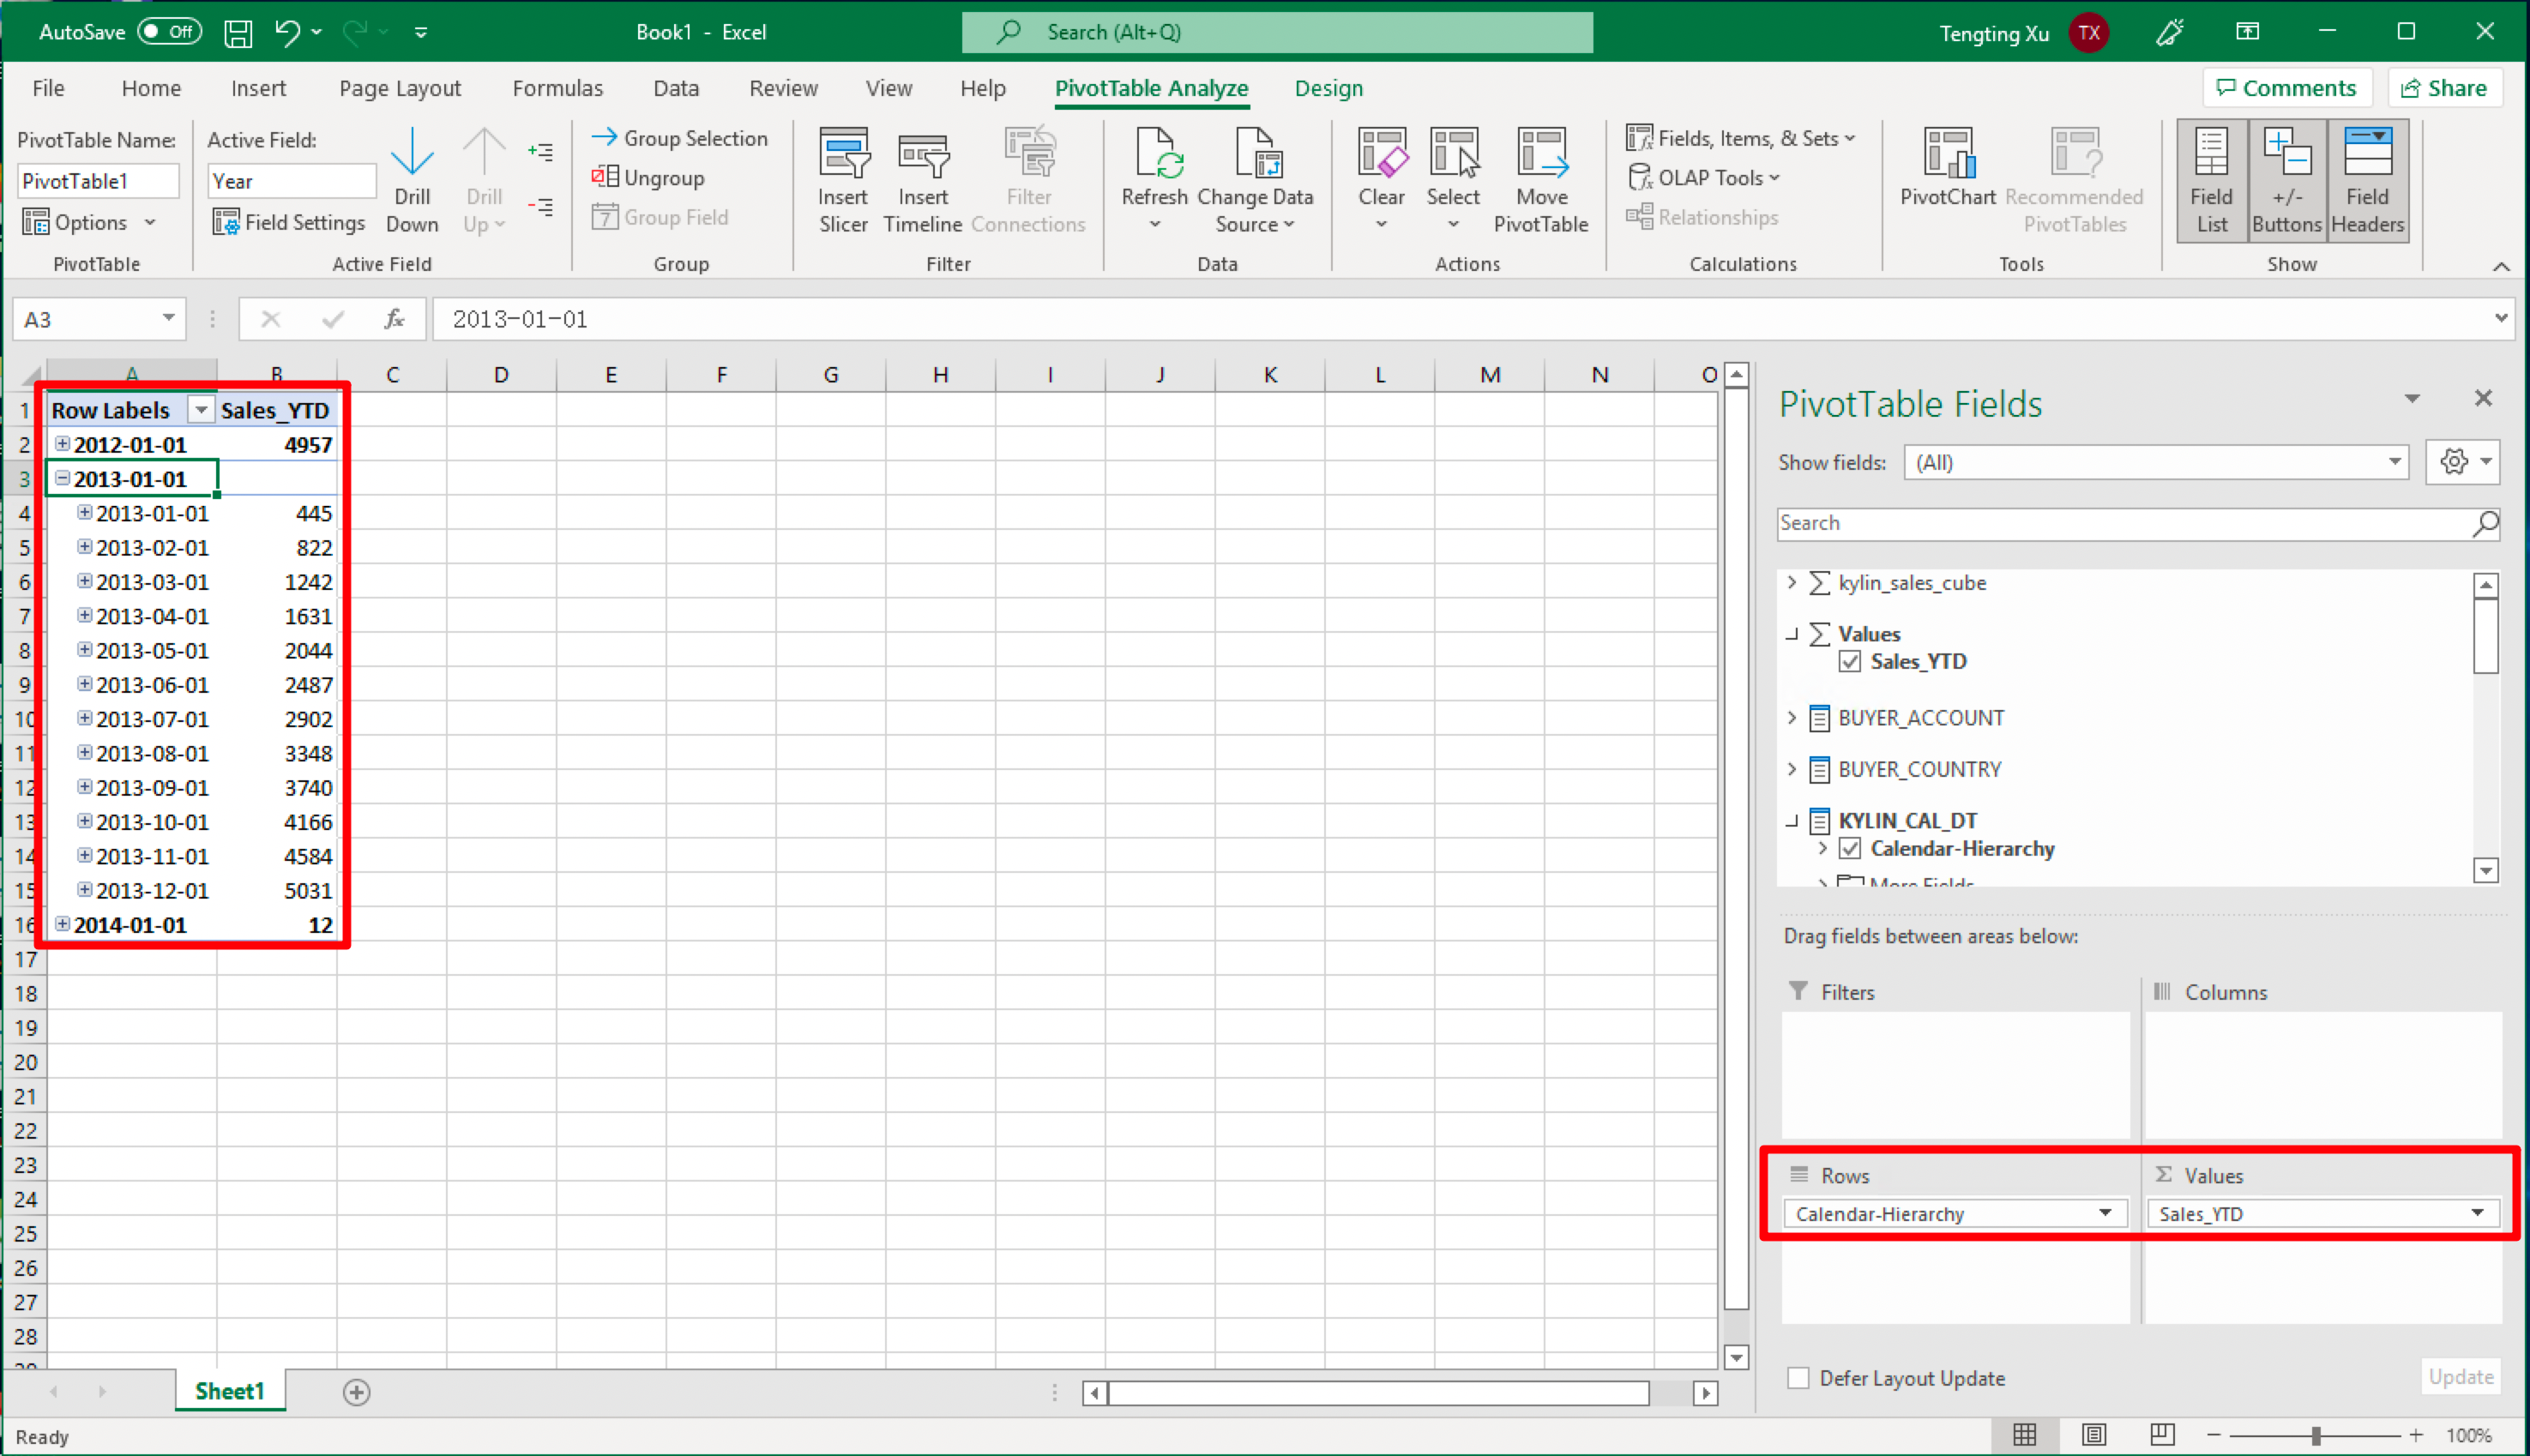
Now you can analyze MDX for Kylin’s dataset using the Excel PivotTable.
Source Code
Please access to https://github.com/Kyligence/mdx-kylin to get source code.